
In March 2018, the video team at The Atlantic produced a series of VR videos focusing on current and former residents of Bon Air, the last juvenile detention facility remaining in Virginia. In addition to building a custom landing page to showcase the video series, I modeled a resident’s cell in Maya 3D based on the footage shot inside it. I then exported it into a format usable by ThreeJS, to create a WebVR interactive that accompanies the documentary series.
In this talk I jointly gave with Mike Howsden, DevOps Lead at The Atlantic, I detailed the way we have used NGiNX, together with uWSGI, Phusion Passenger, and Jenkins, to build a continuous delivery pipeline for QA. Every pull request opened on our private GitHub repository provisions a full instance of our site’s stack, in as little as 10 minutes, using very few incremental resources.
While testing the limits of using ctypes to access CPython internals, I became interested in whether it would be possible to monkeypatch integer addition at runtime using only python (framing it around the trope of “2 + 2 = 5”). Surprisingly, this can be done (see python-doublescript), so I turned this experiment in monkey-patching python integer addition into a talk I gave at EuroPython 2017.
In this talk I discussed how we are using uWSGI at The Atlantic for zero-downtime deploys.
This talk discussed how, in building a WYSIWYG interface for editing the homepage of theatlantic.com, we used Knockout for two-way data binding of django formsets to allow sorting with drag-and-drop functionality, inline editing of html, and image uploads and cropping.
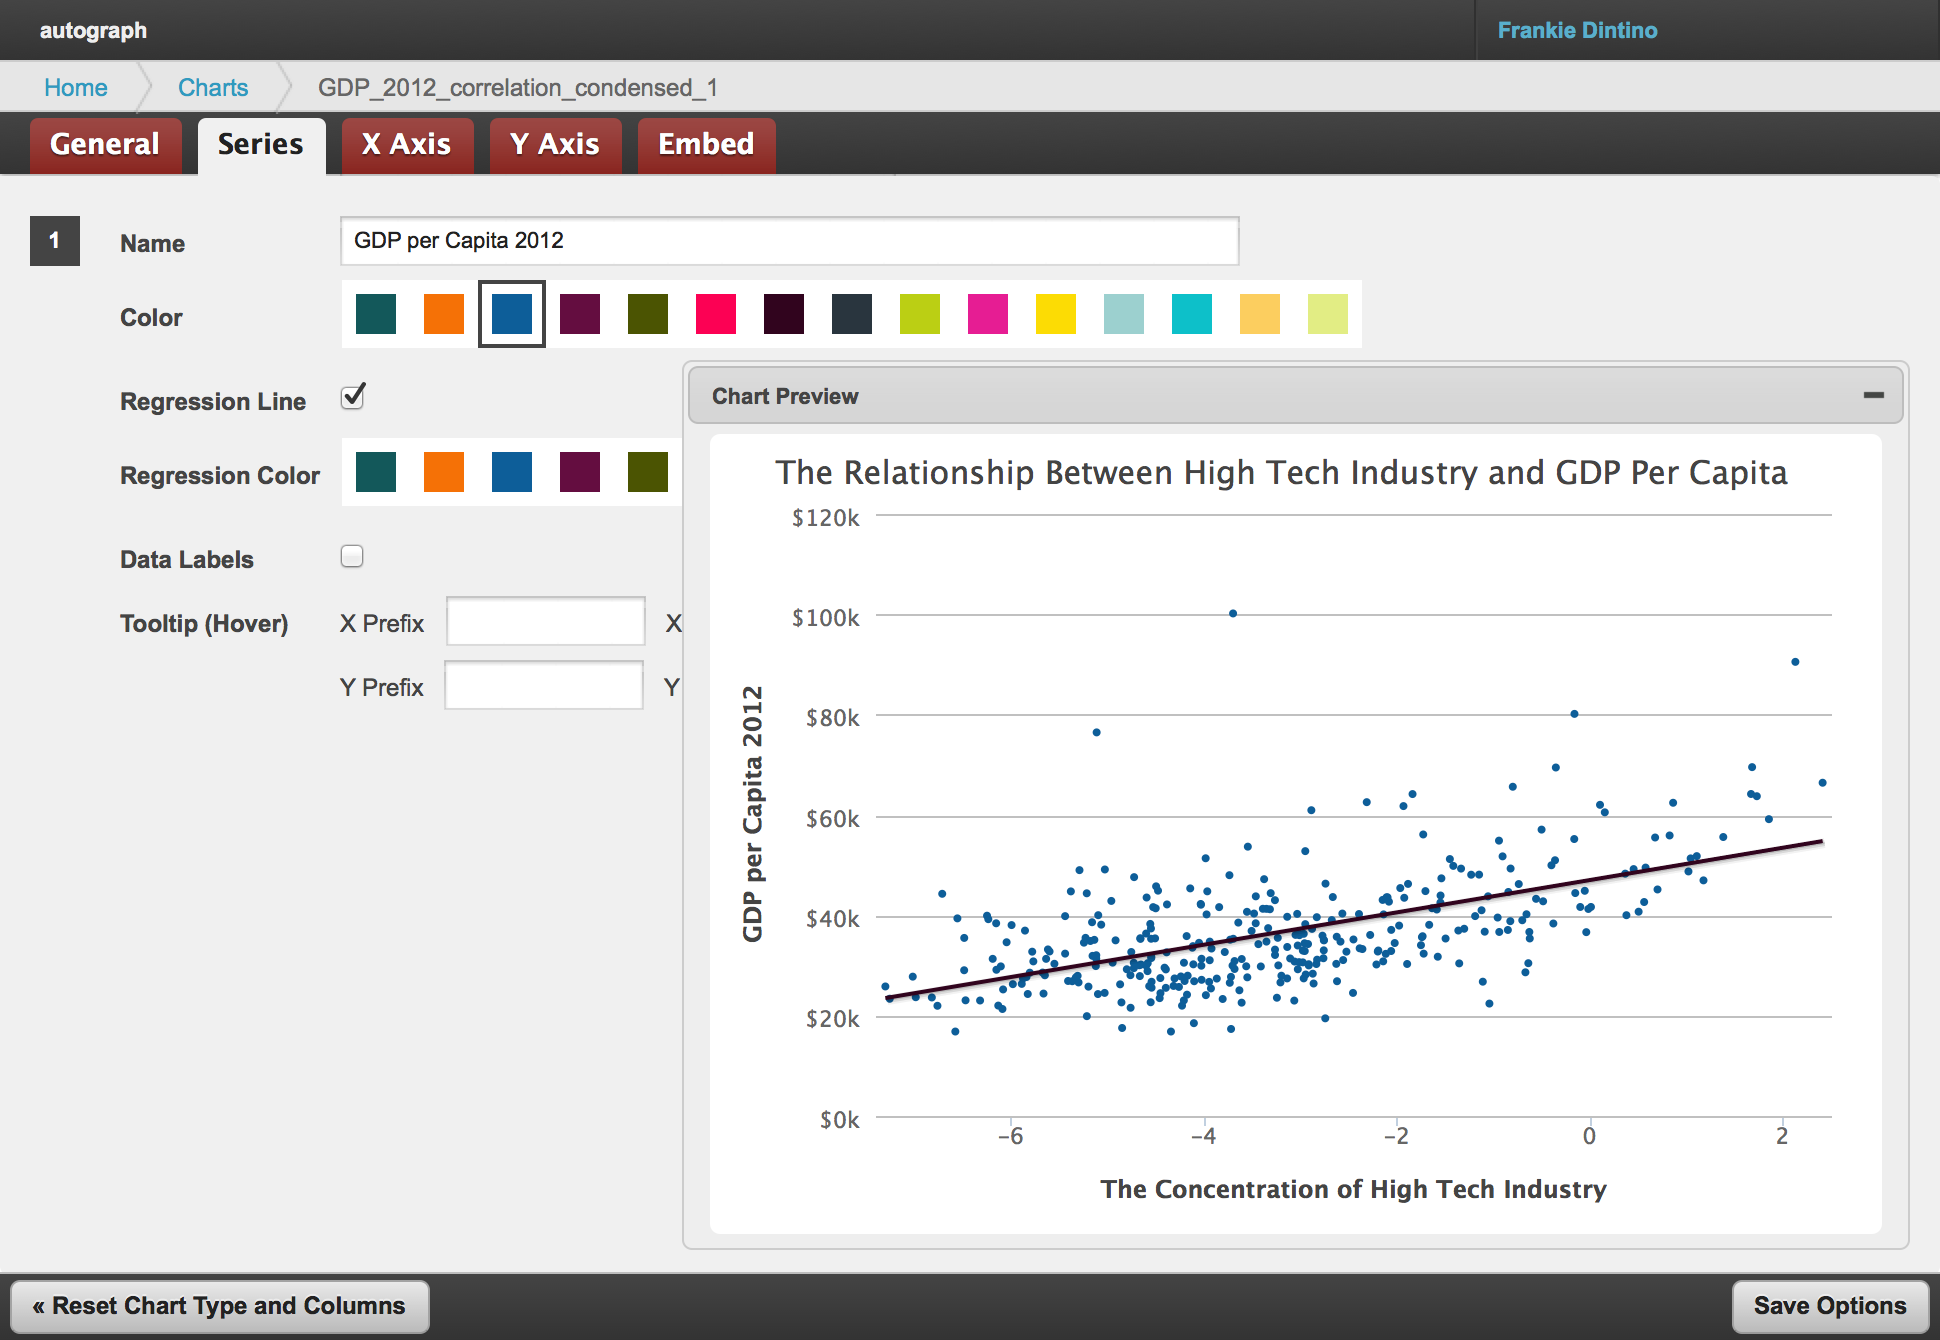
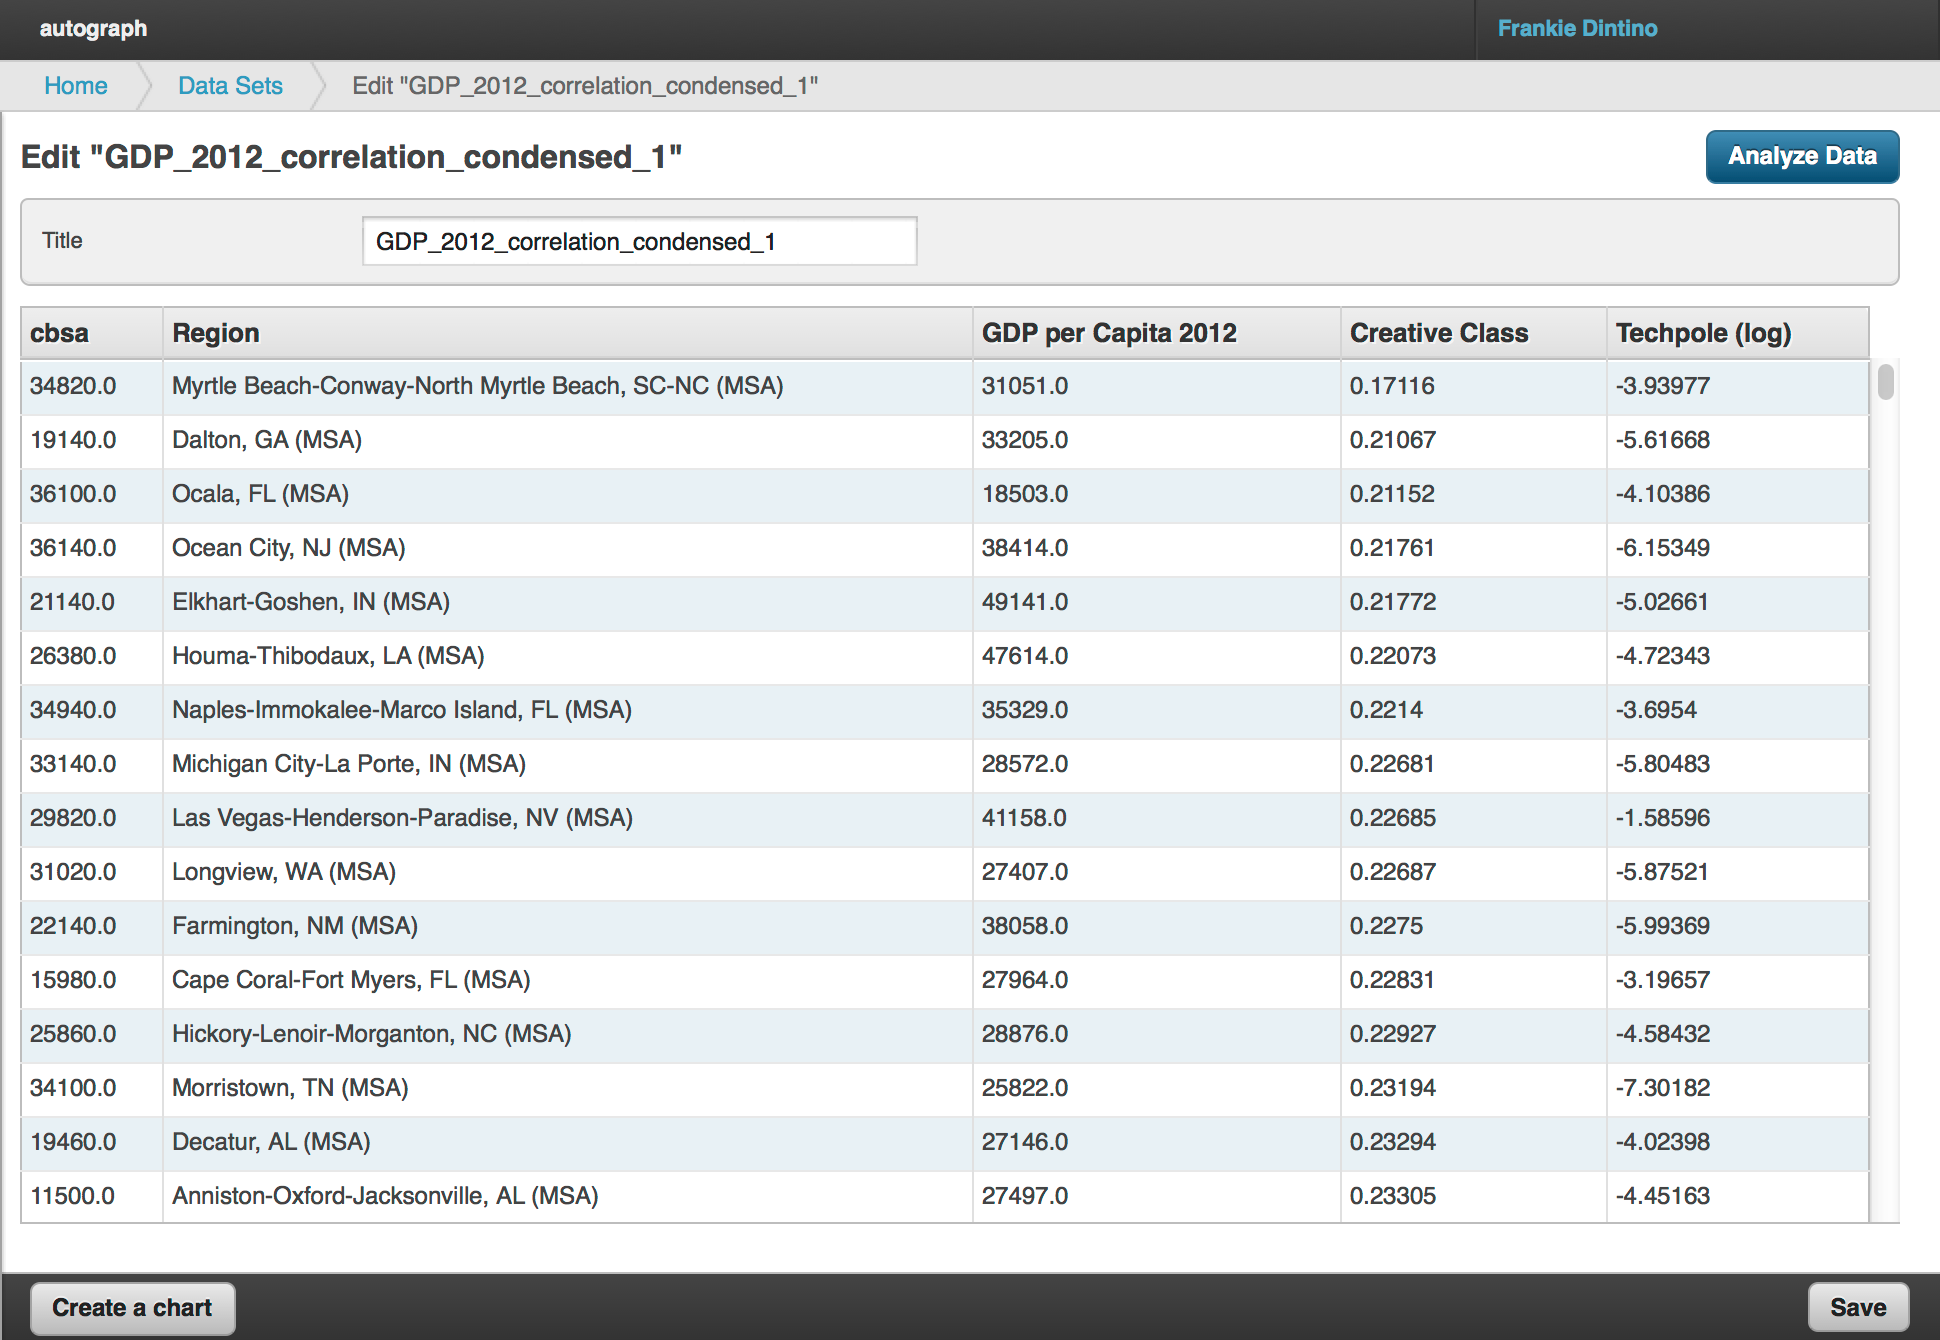
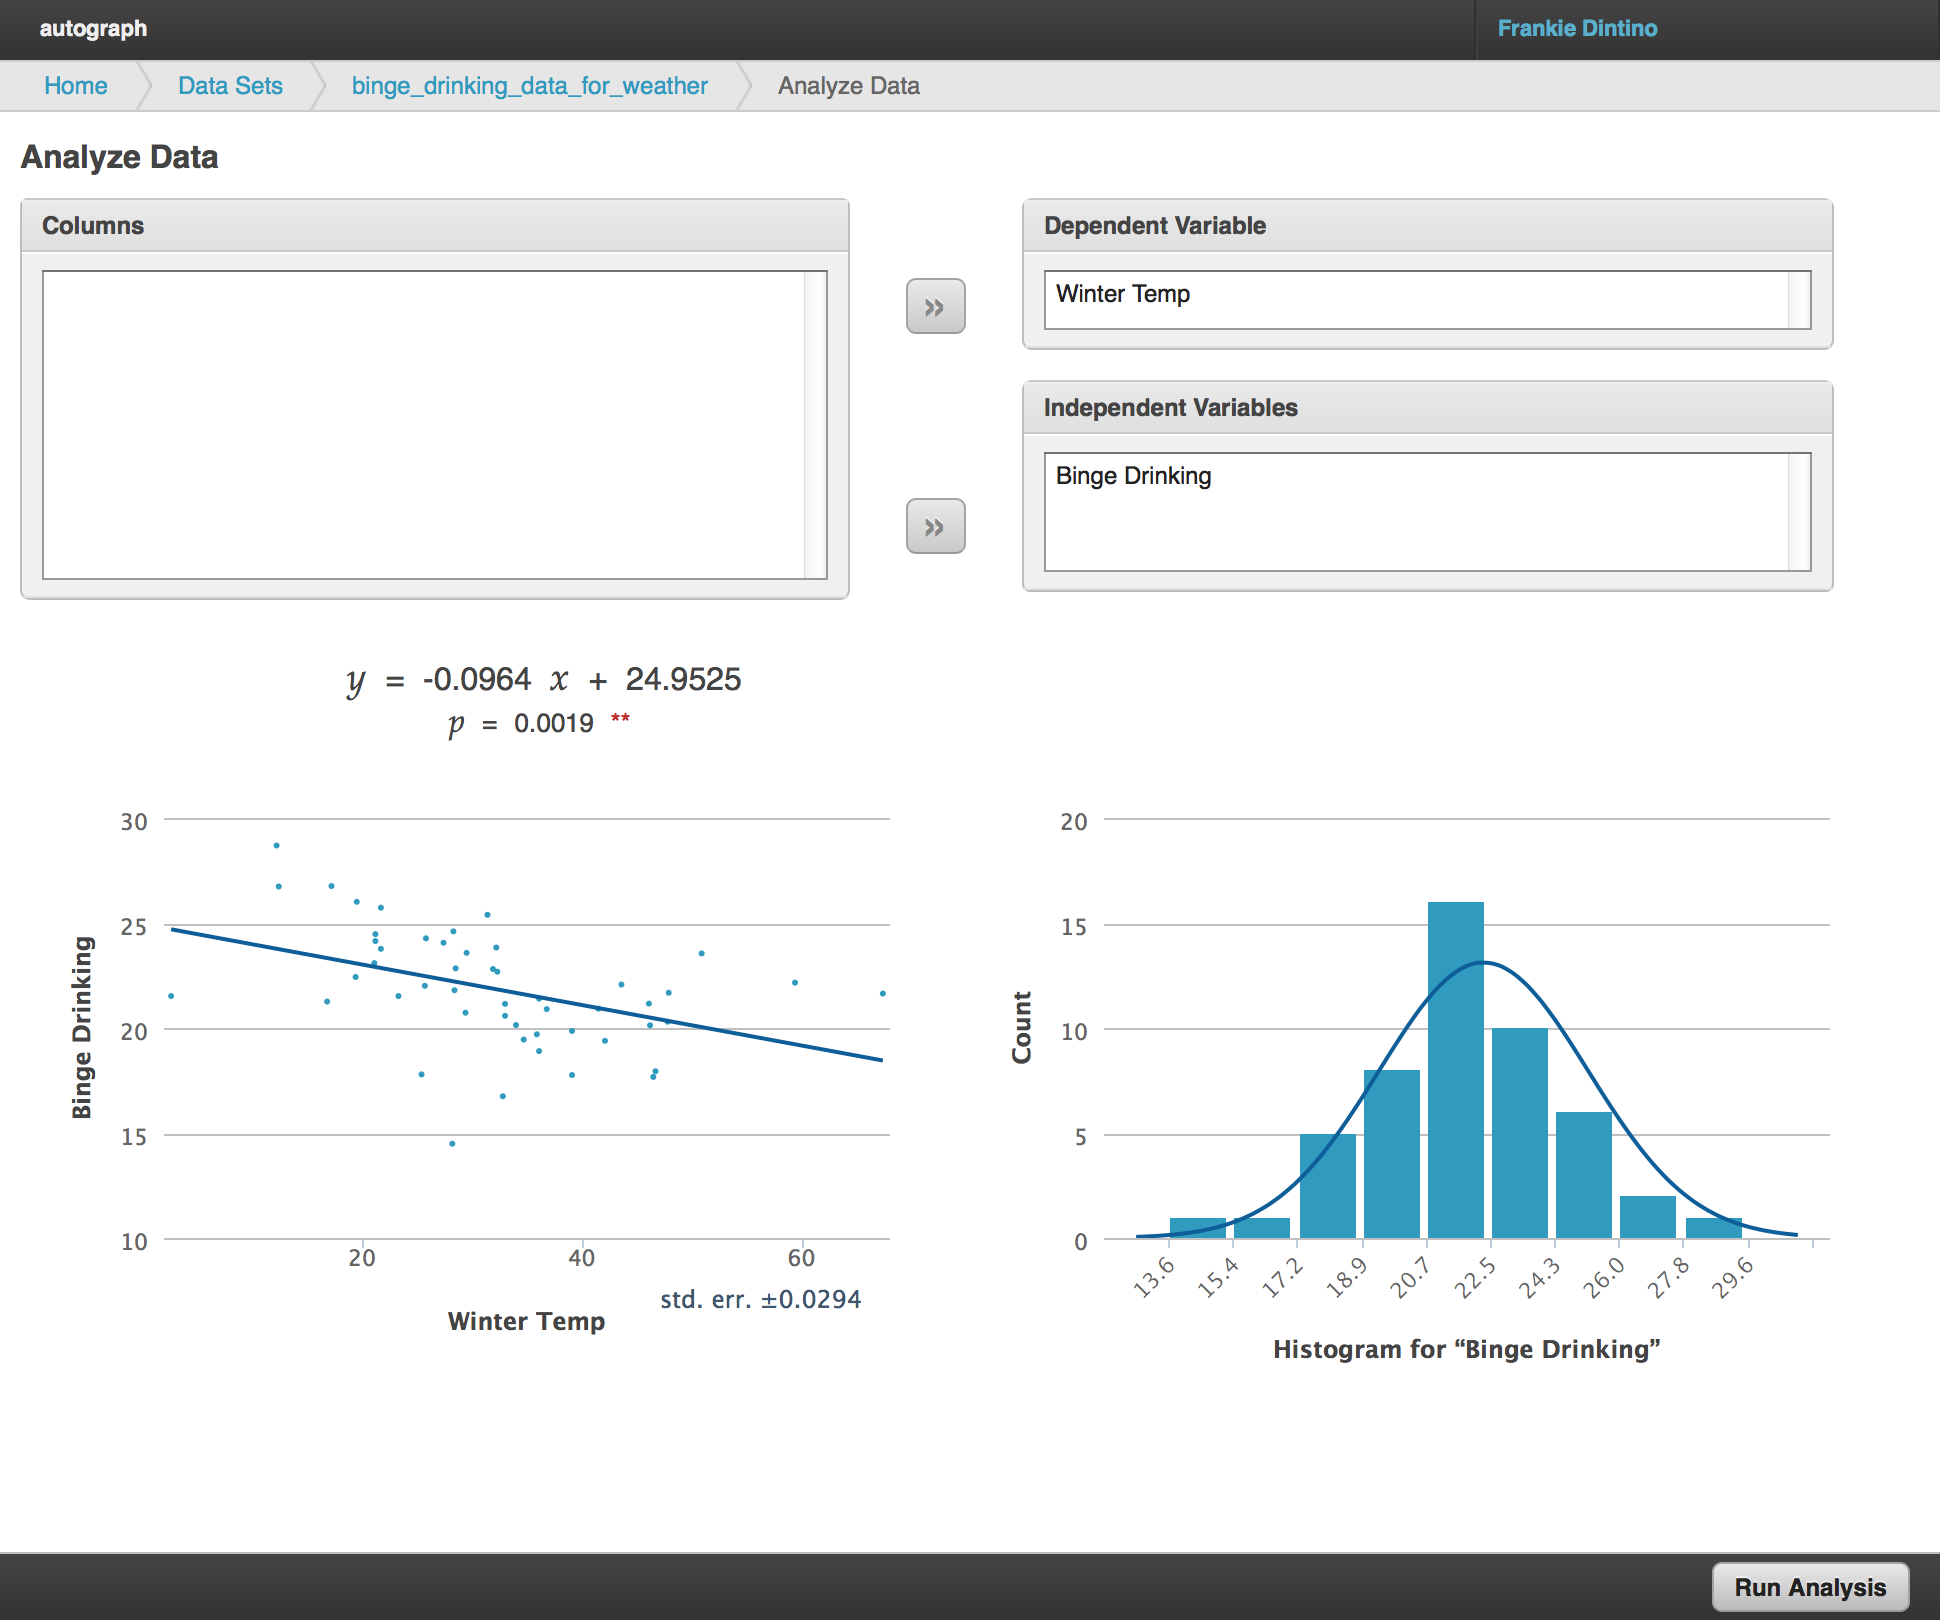
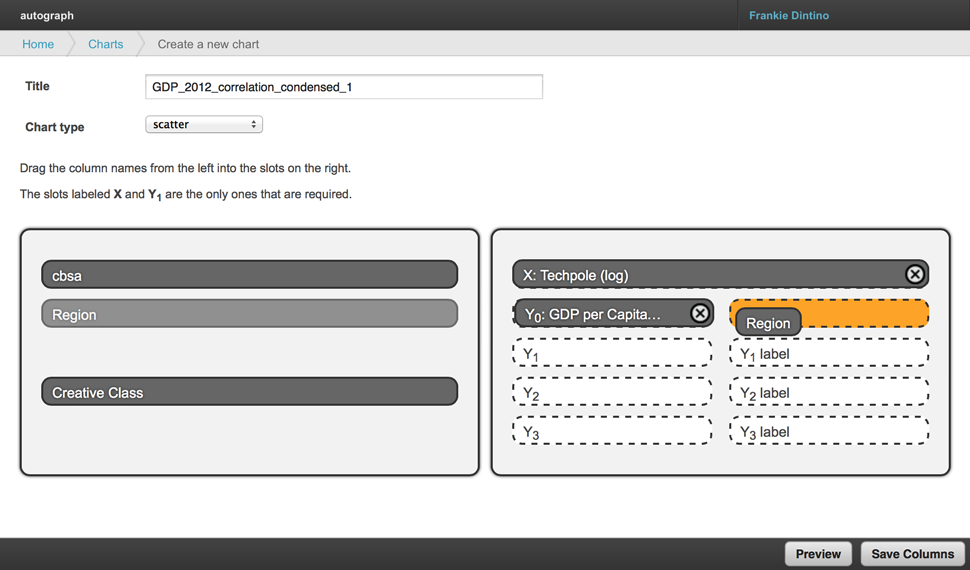
In September of 2011 The Atlantic launched a new sister-site—The Atlantic Cities (presently known as CityLab)—aimed at exploring urban issues and stories about life in cities for the people who research, manage, and live in them. One of the editorial goals of Cities is to place an emphasis on telling stories using a variety of media, from charts and maps to photos and video. To that end I was asked to revisit a prototype of a chart-building tool I had built and demoed several months prior for turning excel spreadsheets into interactive charts using the Highcharts javascript library.
That fall I turned my prototype into “Autograph,” a Django application for managing datasets, performing basic regression analysis, and building customized charts. While Autograph itself is not open-source several of its components are, including py4j-highcharts, a Java application that renders and rasterizes charts server-side for building previews and thumbnails. py4j-highcharts uses py4j, a library for bridging python and Java applications, to be able to take advantage of Java libraries such as Rhino and Batik.
In the lead-up to the 2012 election I was contracted to design and build a new campaign website for Ted Deutch's re-election campaign in Florida’s 21st congressional district. The result, tedforcongress.com, is built in Django and allows campaign staff to update the site content, add pages, and even edit the site’s templates from the admin.
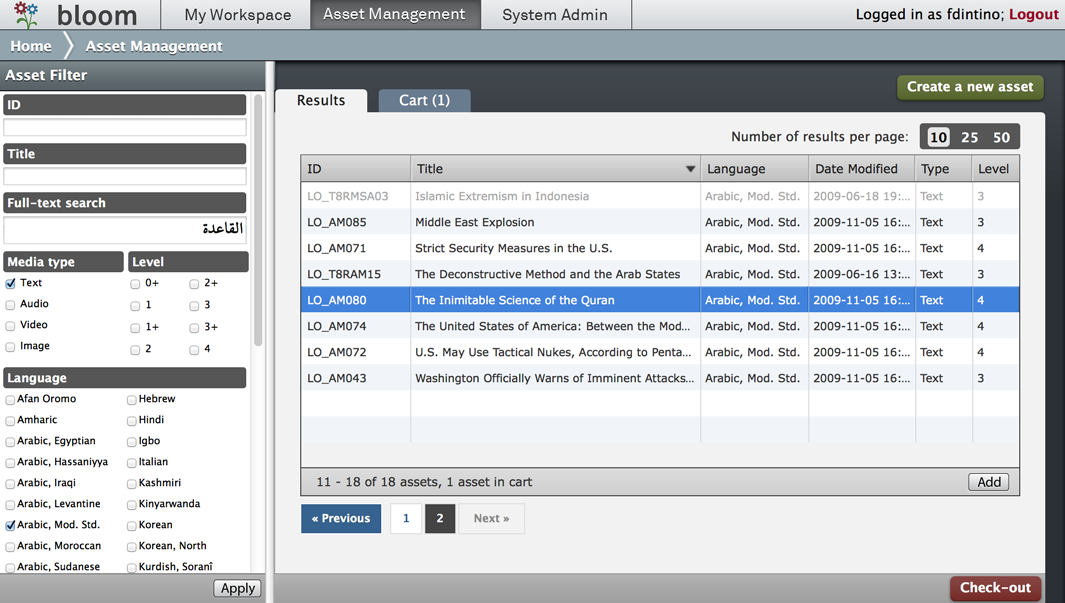
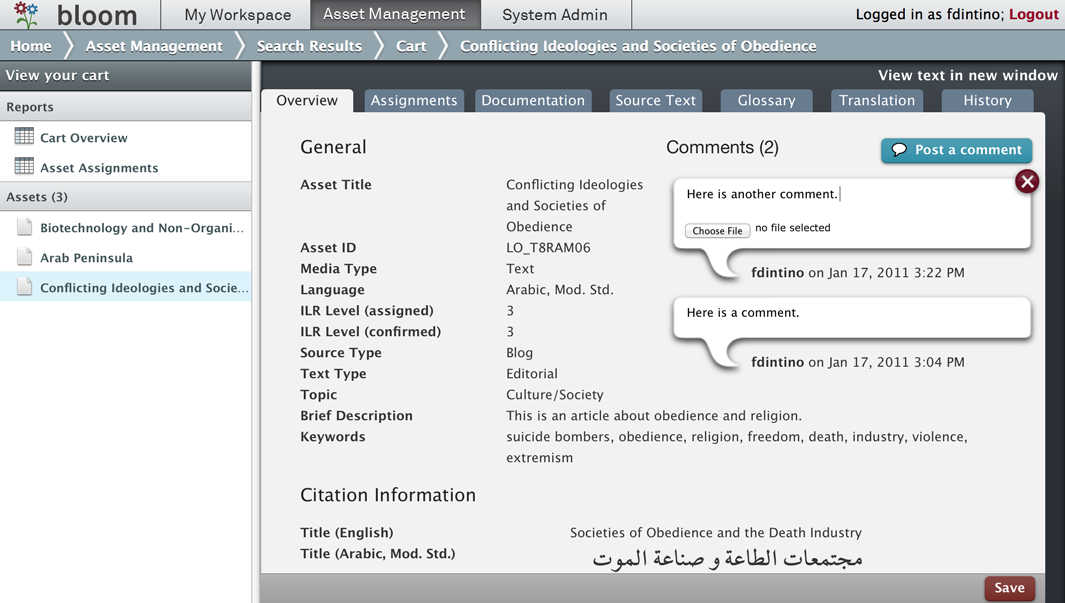
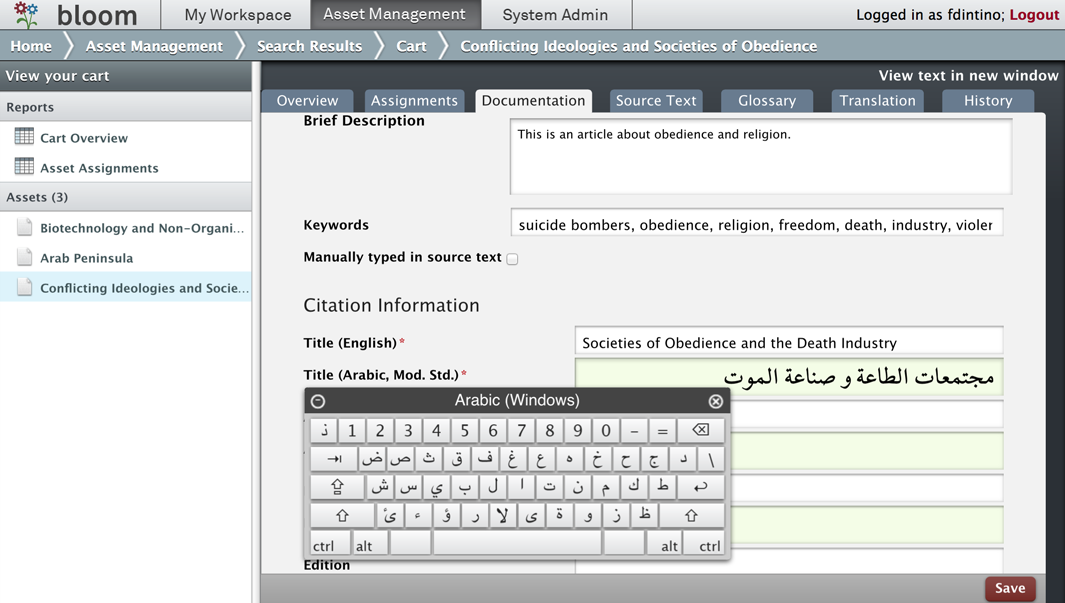
From December of 2009 to September 2010 I was the lead programmer on Bloom, a web-based CMS designed to meet the National Foreign Language Center's need for a flexible and modular authoring environment for creating language-related activities.
At the time I left, Bloom provided for the entry and storage of authentic source materials in 46 languages. These source materials, or "assets," are solicited from consultants across the globe who are charged with finding and uploading high-quality text and audio content. These "assets" are then sent through a rigorous QA process before eventually being used to create activities for language instruction and language proficiency assessment.


